How is the jar test conducted to determine the iron(III) chloride dosage at your plant?
By فريق Egy Chem Hub
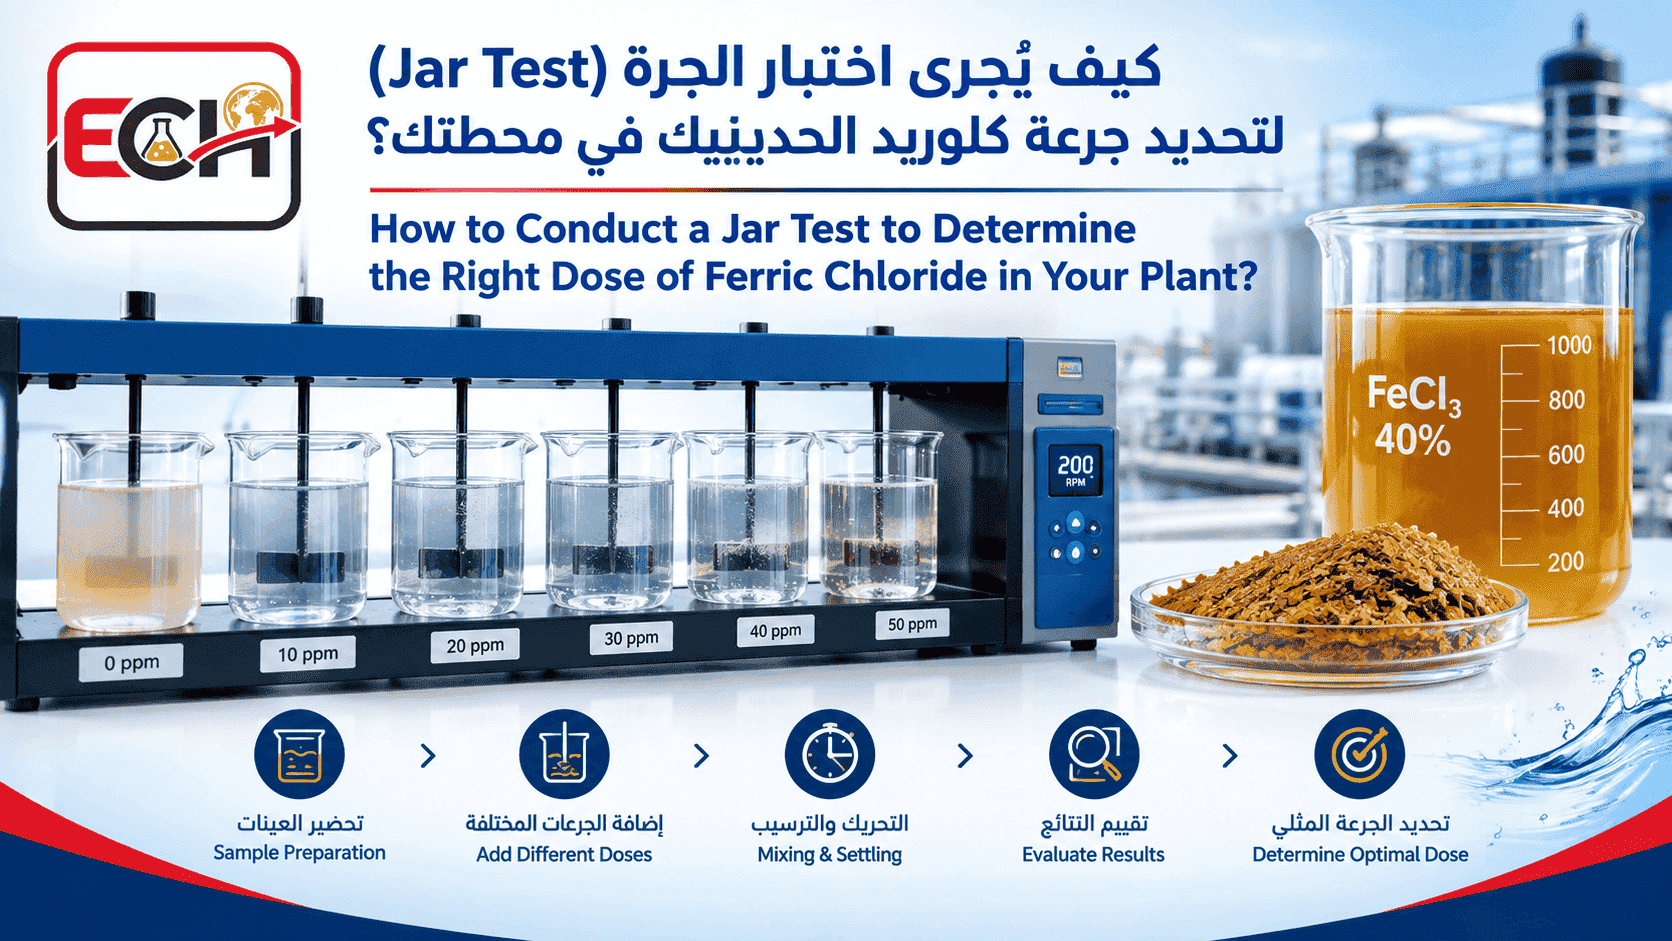
Iron Chloride Dosage (III) (scientifically known as iron(III) chloride or ferric chloride) suitable for your plant cannot be taken from a table; it varies depending on the water’s turbidity, alkalinity, temperature, and the nature of the contaminants present. For this reason, the technical data sheet for a 40% iron(III) chloride solution states that the optimal dosage is determined by conducting a jar test on the water to be treated. This article explains how the test is conducted in practice, what is measured, how to interpret the results, and what precautions to take when applying them at the plant.
To compare ferric chloride (III) and alum, see our dedicated article; for product specifications, see our previous article on 40% ferric chloride (III) solution.
What Does the Jar Test Do?
The test simulates the actual treatment process using small samples: rapid mixing, followed by slow mixing to form flocs, and then gravitational settling. Each sample is given a different dose, and the results are compared. The ASTM D2035-19 standard (“Standard Practice for Flocculation and Coagulation Tests in Water”) describes a general procedure for this, allowing for the comparison of coagulants and their aids in the same water under the same conditions, and for the study of the effects of concentration and order of addition. AWWA M37 (3rd edition, 2011) also devotes an entire chapter to flocculation testing.
Details vary between references and treatment plants; therefore, establish a standardized procedure for your plant and adhere to it consistently to ensure results are comparable over time.
Equipment and Safety
- A turbidity tester (four to six turbidity cells) with synchronized paddles and a rotation speed indicator, and turbidity cells with a capacity of 1 to 2 liters. Some procedures prefer square turbidity cells because they more closely mimic plant behavior.
- A 1-liter volumetric flask, a precision scale, syringes or pipettes (one per batch), and a timer.
- A turbidity meter, a pH meter, a thermometer, filtration equipment, and a method for measuring residual iron.
Safety: The product is highly acidic (pH less than 1 according to the safety data sheet). The safety data sheet classifies it as potentially corrosive to metals, harmful if swallowed, irritating to the skin, and causing serious eye damage. Wear gloves, eye and face protection, and protective clothing, and consult the Safety Data Sheet (SDS) before use. Since the solution may corrode metals, rinse any metal parts of the device after use.
Step 1: Prepare the Stock Solution
The goal is a diluted solution that is easy to measure accurately. A common method is a 1% solution; each 1 mL of this solution in a 1-liter bottle yields a concentration of 10 mg/L.
- Weigh 10 g of the product into a glass or plastic container. Weighing is more accurate than measuring by volume because the density of the solution varies slightly (data sheet: specific gravity 1.42 ± 0.02 at 20 °C).
- Transfer it to a 1-liter volumetric flask containing a small amount of deionized water, then make up to the mark with water and mix.
- Record the date of preparation. We recommend preparing the diluted solution immediately before testing; if an older solution is used, compare its result with that of a fresh solution.
Important: The method used to prepare the solution must match the method used to calculate the dose; therefore, always specify the basis for expressing the dose. Doses are sometimes expressed in references as FeCl₃·6H₂O (as in the Australian Drinking Water Guide) and sometimes as iron (Fe) (as in the Delft University laboratory manual). According to the data sheet, a 40% iron(III) chloride solution contains FeCl₃ at a concentration of 40% ± 2% by weight (the formula FeCl₃ refers to the anhydrous compound) and 13 to 14% iron. Therefore, each 1 mg/L of the product is equivalent to approximately 0.4 mg/L FeCl₃ and approximately 0.13 to 0.14 mg/L Fe.
Step 2: Selecting the Dosage Range
- Set the plant’s current dosage (if any) in the middle of the range, and place lower and higher dosages around it. The Texas Commission on Environmental Quality (TCEQ) training manual recommends that dosages fall within the range expected to be used at the plant.
- For new water or a new product, start with an exploratory round using widely spaced steps, then conduct a second, narrower round centered on the best dose.
- Use one batch as a control without coagulant.
- Change only one variable per round: either the dosage or the pH, not both.
The following example is a calculation intended only to illustrate the conversion; it does not represent recommended dosages (1% stored solution of the product, 1-liter batch):
| Volume of stock solution (mL) | Dosage in terms of product (mg/L) |
|---|---|
| 0 (control) | 0 |
| 1 | 10 |
| 2 | 20 |
| 3 | 30 |
| 4 | 40 |
| 5 | 50 |
If the optimal dose in this round is 20 mg/L, the second round can range from 14 to 26 mg/L in 2 mg/L increments (1.4 to 2.6 mL).
Step 3: Operation
- Collect a sample representative of the raw water before any chemical additions, and measure its turbidity, pH, alkalinity, and temperature. Match the test temperature to the plant’s temperature, as cold water slows the reaction and increases viscosity.
- Fill the vials to the same volume, and prepare the doses in syringes or pipettes.
- Start rapid mixing and add the doses simultaneously or in a uniform manner.
- Switch to slow mixing and record the time of the first floc formation and its size.
- Stop mixing and allow the vials to settle without agitation.
- Draw samples from the same depth in each vial (some procedures use a depth of about 2 cm below the surface).
There is no single standard for speed and time; published examples show wide variation:
| Source | Fast mixing | Slow mixing | Settling |
|---|---|---|---|
| California Water Resources Board Guidelines (2020) | 200 rpm, 20–30 s | 20–30 rpm, 5 min | 25 min |
| Delft University Laboratory Material (with FeCl₃) | 200 rpm, 10–15 s | 30 rpm, 20 min | 20 min |
| Ugu Municipality Procedure (South Africa) | 100 rpm, 2 min | 40 rpm, 15 min | 15 min |
| NPTEL Course Materials | 100 rpm, 1 min | 25–35 rpm, 15–20 min | 30–45 min |
Select a setup that simulates the mixing time and intensity at your facility. The TCEQ reference links rapid mixing time to the size of the mixing tank and water flow rate, and rotation speed to the design acceleration (G) value. The relationship between revolutions per minute and the G-value depends on the shape of the flask and the paddle; therefore, do not transfer revolution per minute values from one reference to another without calibration.
What Do We Measure?
| Measurement | Purpose |
|---|---|
| Turbidity after sedimentation (NTU) | Key indicator; measured for each batch |
| Turbidity after filtration | A small sample is filtered using filter paper or a membrane; useful for plants that follow sedimentation with filtration |
| pH (before and after addition) | Lowered by iron(III) chloride because it consumes alkalinity |
| Residual Iron (mg/L) | Tracks the iron remaining in the water after sedimentation or filtration |
| Color | Required if it is among the treatment objectives (listed as a parameter to be measured in ASTM D2035-19) |
| Floc description | Time of appearance, size, and settling rate |
| Effluent | Total suspended solids (TSS), chemical oxygen demand (COD), and others depending on the plant’s objectives |
Regarding residual iron: It can be measured using the phenanthroline colorimetric method (Standard Methods 3500-Fe B) or inductively coupled plasma atomic emission spectroscopy (ICP-AES, EPA Method 200.7), taking care to distinguish between total and dissolved iron (dissolved iron is measured after filtration). For drinking water, the U.S. Environmental Protection Agency (EPA) and the Australian Drinking Water Guidelines set a limit of 0.3 mg/L for iron for aesthetic reasons (rusty color, metallic taste, and staining), not for health reasons. The binding limit is set by the regulatory authority in your country.
Interpreting the Results
- Plot residual turbidity against dose, and check the pH and residual iron for the filtered doses.
- Select the lowest dose that achieves the treatment goal, not the dose that produces the clearest water. In a study published on wastewater from a poultry processing plant, the optimal dose was defined as the lowest dose that resulted in turbidity below a certain threshold and flocculation within the specified time; it was found that higher doses did not improve turbidity.
- Do not rely solely on the turbidity of the filtered water. California guidelines consider it a relative indicator that does not necessarily correspond to the treatment plant, and rely on filtration; and a university thesis indicates that low dosages may produce a small amount of floc that does not settle well, but filters remove it efficiently.
- If no batch meets the target, adjust the dosage range to higher or lower levels, or check the pH, and retest.
- If the pH falls below the required range at the selected dosage, retest after adding alkalinity. The TCEQ guidance notes that alkalinity may need to be added if the coagulant is acidic and the water’s natural alkalinity is low.
From the Flask to the Plant: Cautions
-
The jar test is a guideline, not a replica of the plant. The TCEQ guidance states that no single procedure can replicate all plants, and NPTEL regulations stipulate that results must be compared to the actual system’s performance and adjusted accordingly.
-
Repeat the test when raw water conditions change (turbidity, temperature, alkalinity), as the optimal dosage will vary.
-
Verify at the plant by gradually changing the dosage and monitoring the effluent and filtrate before finalizing the value.
-
Convert the dosage to a feed rate using the same basis. Each 1 mg/L equals 1 g/m³; that is, the dosage in terms of product × flow rate (m³/hour) = grams of product per hour. Hypothetical example: A dosage of 30 mg/L and a flow rate of 200 m³/h yield 6 kg of product per hour, or approximately 4.2 L/h at a density of 1.42 to 1.43 g/cm³ (the specific gravity in the data sheet is 1.42 ± 0.02, and the density in the safety data sheet is 1.43 g/cm³). Then, actually calibrate the injection pump.
-
Check the usage limit If the water is for drinking: The data sheet states that the product is manufactured at a facility listed by NSF International in accordance with NSF/ANSI/CAN 60 for coagulation and flocculation, with a maximum usage limit of 100 mg/L calculated based on FeCl₃ (according to data from Egy Chem Hub).
-
Review handling materials because the solution is highly acidic and may corrode metals.
40% Ferric Chloride Solution from Egy Chem Hub
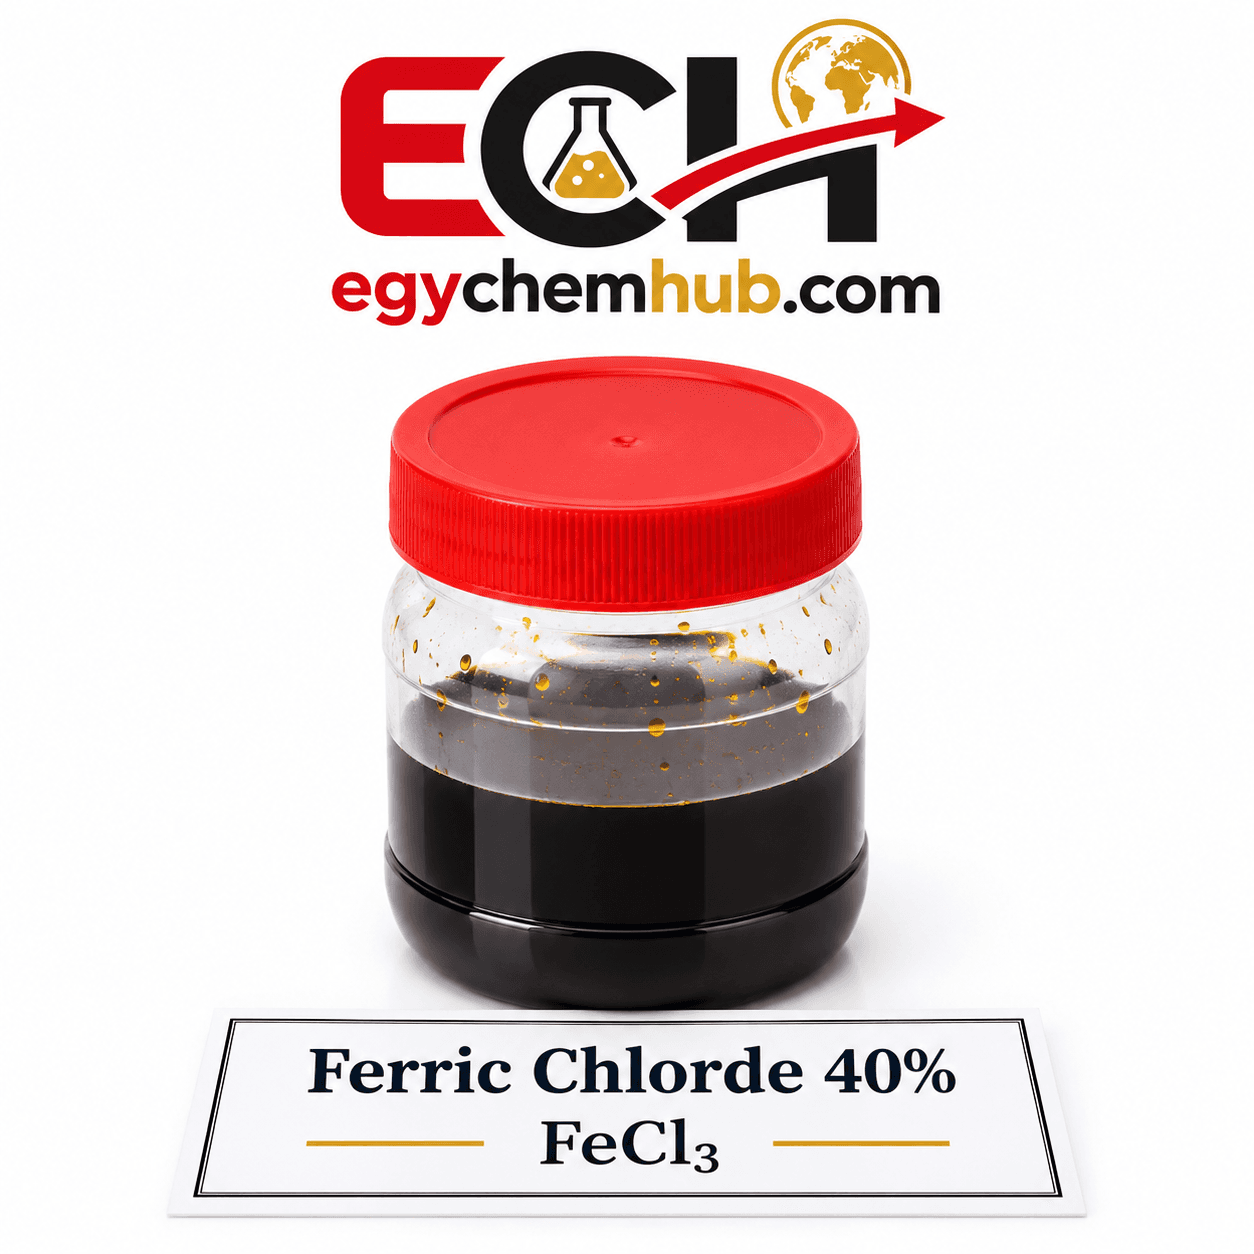
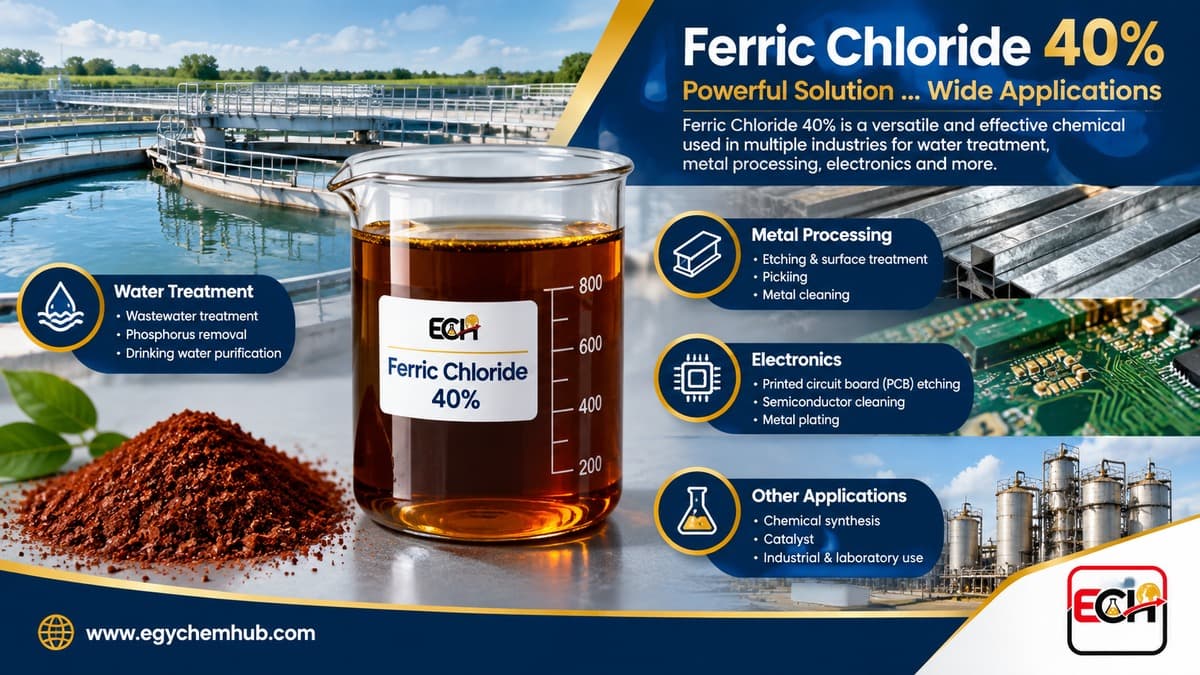
Egy Chem Hub offers a 40% ferric chloride solution (Ferric Chloride Solution 40%, trade name ECH-FR4014), a reddish-brown liquid used for coagulation and flocculation of drinking water, process water, and wastewater. The technical data sheet states that it can be injected either undiluted or after dilution, and that the optimal dosage is determined by a pot test. It is packaged in 280-kg HDPE drums and 1,400-kg IBC containers, is available in bulk, has a shelf life of 12 months, and is manufactured in Egypt. Technical Data Sheets (TDS) and Safety Data Sheets (SDS) are available upon request.
Contact Us
To request a quote or technical specifications for a 40% ferric chloride solution, contact the Egy Chem Hub team and provide details about your raw water and application so we can help you select the appropriate product and packaging.